
Your website is live. Your content is published. But how do you actually know if Google is finding your pages, ranking them, or sending you any traffic at all?
Most website owners publish content and then guess. They assume things are working — until traffic drops and they have no idea why. If you want to stop guessing and start making data-driven decisions, you need to know how to analyze website performance using Google Search Console. It is completely free, directly connected to Google’s own data, and gives you insights no other tool can match.
This complete guide will walk you through every key feature of Google Search Console — what each report tells you, how to read the data correctly, and exactly what actions to take based on what you find. Whether you are a blogger, a business owner, or an SEO professional, mastering how to analyze website performance using Google Search Console is one of the highest-value skills you can develop in 2026.
What Is Google Search Console and Why Does It Matter?
Google Search Console (GSC) is a free tool provided by Google that shows you how your website performs in Google Search results. Unlike Google Analytics — which tracks what visitors do after they arrive on your site — Search Console focuses entirely on what happens before they click.
It answers critical questions like:
- How many times does my website appear in Google Search results?
- Which keywords are people using to find my pages?
- Which pages are getting the most clicks from Google?
- Are there any technical errors stopping Google from crawling my site?
- Is my site mobile-friendly and fast enough to rank well?
When you analyze website performance using Google Search Console, you are working directly with Google’s own data — which makes it the most accurate and reliable source of SEO information available to any website owner.
How to Set Up Google Search Console
Before you can analyze anything, you need to verify your website with Google Search Console.
Steps to get started:
- Go to search.google.com/search-console
- Click Add Property and enter your website URL
- Choose your verification method — the easiest is via Google Analytics (if already set up) or by adding a HTML tag to your website’s header
- Once verified, Google begins collecting data — it typically takes 24 to 48 hours for initial data to appear
- For full data access, connect Search Console to your Google Analytics account from the Admin settings
After setup, you will have access to a powerful dashboard filled with actionable performance data about every page on your website.
The Performance Report — Your Most Important Dashboard
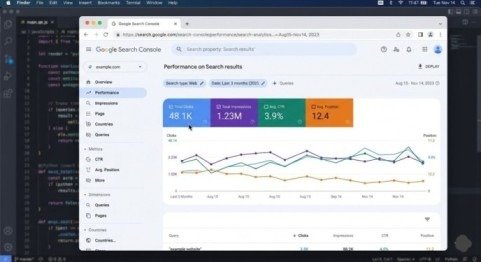
The Performance Report is the heart of Google Search Console and the first place to go when you want to analyze website performance. It shows you four critical metrics for every page and keyword on your site.
The 4 Key Metrics to Understand
1. Impressions The number of times your website URL appeared in Google Search results. A high impression count means Google is showing your pages — but if clicks are low, your titles and meta descriptions need improvement.
2. Clicks The number of times users actually clicked your link in search results and visited your website. This is the metric that directly translates to traffic.
3. Click-Through Rate (CTR) Clicks divided by impressions, expressed as a percentage. A low CTR means people are seeing your site in results but choosing not to click. Industry average CTR for position 1 is around 28–30%, dropping sharply as position drops.
4. Average Position Your average ranking position in Google Search results for a given page or keyword. Position 1 is the top result. Anything above position 10 means you are on page one of Google.
How to Use the Performance Report Effectively
- Click the Queries tab to see exactly which keywords are driving impressions and clicks to your site
- Click the Pages tab to see which individual pages are performing best and worst
- Use the Date filter to compare current performance against previous periods (last 28 days vs previous 28 days)
- Filter by Country and Device to understand where your traffic comes from and whether mobile or desktop users dominate
Action tip: Find pages with deep impressions but low CTR — these are your quickest wins. Rewrite their title tags and meta descriptions to be more compelling, and you will get more clicks without needing to improve rankings at all.
The URL Inspection Tool — Understand How Google Sees Any Page
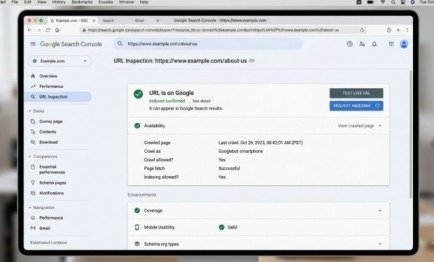
The URL Inspection Tool lets you check the status of any individual page on your website. Simply paste a URL into the search bar at the top of Search Console and Google shows you exactly how it processes that specific page.
What it tells you:
- Whether the page is indexed in Google or not
- The last time Google crawled the page
- Whether there are any crawling or indexing errors
- How the rendered version of your page looks to Google
- Whether canonical tags are set up correctly
When to use it:
- After publishing a new page — request indexing immediately to speed up Google’s crawling
- When a page is not appearing in search results despite being live
- After making major updates to a page — re-request indexing to ensure Google picks up the changes
To request indexing, open the URL Inspection Tool, paste your page URL, and click Request Indexing. Google will typically crawl the page within a few hours to a few days.
The Coverage Report — Fix Indexing Errors Immediately
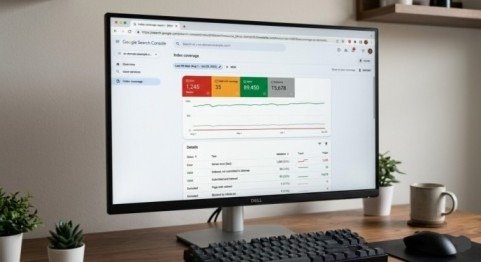
The Coverage Report (also called the Index report in newer versions of GSC) shows you the indexing status of every page Google has discovered on your website. This report is essential when you analyze website performance using Google Search Console because unindexed pages receive zero traffic from Google — no matter how good the content is.
The four status categories:
- Valid — Pages successfully indexed and eligible to appear in Google Search
- Valid with warnings — Indexed but with issues that may affect performance
- Excluded — Pages not indexed, often intentionally (noindex tags, duplicate content, redirects)
- Error — Pages Google tried to index but failed — these need immediate attention
Common errors to fix:
- 404 Not Found — Page does not exist; fix the URL or set up a proper redirect
- Server errors (5xx) — Server failed to respond; contact your hosting provider
- Redirect errors — Broken redirect chains that need to be resolved
- Submitted URL blocked by robots.txt — Your robots.txt file is accidentally blocking Google from crawling important pages
Fix errors in order of priority — pages with the most traffic potential first.
The Core Web Vitals Report — Page Speed and User Experience
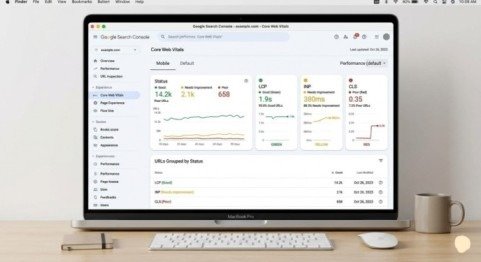
In 2026, Google’s ranking algorithm places significant weight on Core Web Vitals — a set of real-world performance metrics that measure how fast and smoothly your pages load for actual users.
The three Core Web Vitals metrics:
1. Largest Contentful Paint (LCP) Measures how long it takes for the largest visible element on the page to load. Target: under 2.5 seconds.
2. Interaction to Next Paint (INP) Measures how quickly your page responds to user interactions like clicks and taps. Target: under 200 milliseconds.
3. Cumulative Layout Shift (CLS) measures how much page elements shift around unexpectedly during loading. Target: below 0.1.
Pages that fail Core Web Vitals are marked as Poor in Search Console. These pages may rank lower than competitors with better performance scores, even if the content quality is equal.
How to improve Core Web Vitals:
- Compress and properly size all images
- Use a fast, reliable hosting provider
- Enable browser caching and use a Content Delivery Network (CDN)
- Remove or defer unnecessary JavaScript and CSS files
- Use lazy loading for images below the fold
The Core Web Vitals report in Search Console shows you exactly which pages need improvement and what issues are causing the problems.
The Links Report — Understand Your Backlink Profile
The Links report in Google Search Console shows you two critical categories of links that affect your SEO performance.
External links (Backlinks): These are links from other websites pointing to your pages. Backlinks are one of Google’s strongest ranking signals. The Links report shows you which external sites link to you most, and which of your pages attract the most backlinks.
Internal links: These are links within your own website connecting your pages. A strong internal linking structure helps Google discover and index your content faster and distributes ranking authority across your site.
Action tips:
- Identify your most-linked pages and create more content on similar topics
- Find pages with zero internal links and add links to them from relevant existing content
- Reach out to websites that link to competitor pages and pitch your own content as a resource
How to Track Progress and Measure SEO Improvements
Once you analyze website performance using Google Search Console regularly, you need a system for tracking whether your SEO efforts are actually working.
Build a simple weekly monitoring routine:
- Open the Performance Report and compare this week to the previous period
- Check if average position improved for your target keywords
- Review the Coverage report for any new errors that appeared
- Check Core Web Vitals for any pages that moved from Good to Poor status
- Use the URL Inspection tool on any newly published pages to request indexing
Set up email alerts in Google Search Console under Settings to be notified automatically when Google detects manual penalties, security issues, or significant coverage problems on your site.
Final Thoughts
Google Search Console is not just a diagnostic tool — it is your direct line of communication with Google about your website. Every piece of data it provides is an opportunity to improve your rankings, fix problems before they damage your traffic, and make smarter content decisions based on real search data.
When you consistently analyze website performance using Google Search Console, you move from guessing to knowing. You stop wondering why your traffic dropped and start understanding exactly what to fix. You stop publishing content blindly and start targeting keywords you already know are driving impressions.
Frequently Asked Questions (FAQs)
Q1: How long does it take for Google Search Console to show data?
Initial data typically appears within 24 to 48 hours after verification. Full performance data builds up over the first few weeks as Google crawls and indexes your pages.
Q2: Is Google Search Console free to use?
Yes, completely free. Google Search Console is a free tool available to any website owner with a Google account.
Q3: What is the difference between impressions and clicks in Search Console?
Impressions count how many times your page appeared in search results. Clicks count how many times a user actually clicked your link. A high impression count with low clicks means your title or meta description needs to be more compelling.
Q4: How do I fix a page that is not being indexed by Google?
Use the URL Inspection Tool to check the page status. If it shows a crawl error, fix the underlying issue. If it is simply not indexed yet, click Request Indexing to prompt Google to crawl it sooner.
Q5: How often should I check Google Search Console?
At a minimum, check once per week. For high-traffic or e-commerce websites, daily monitoring of the Performance and Coverage reports is recommended.
Meta Description:
Learn how to analyze website performance using Google Search Console in 2026. Track clicks, impressions, CTR, and fix issues to rank higher on Google.