
Your best-performing pages generate thousands of impressions but almost zero clicks because you never analyzed the Performance Report in Google Search Console to discover your titles fail to attract attention.
Learning how to use Performance Report in Google Search Console for SEO transforms visibility into actual traffic. This powerful analytics tool reveals which search queries trigger your pages, how often users see your content in results, whether your titles and descriptions compel clicks, and where ranking improvements deliver maximum traffic gains. Without systematic analysis of the Performance Report in Google Search Console, you waste SEO efforts optimizing pages Google already ranks highly while ignoring quick wins waiting just below the first page.
Most website owners check total clicks occasionally, celebrate when numbers increase, and panic when they drop—never digging deeper to understand why changes occur or where untapped opportunities hide. The Performance Report in Google Search Console contains strategic intelligence that pinpoints exactly which pages need better titles, which queries deserve content expansion, and which ranking improvements deliver disproportionate traffic gains.
This comprehensive 2026 guide reveals how to use Performance Report in Google Search Console for SEO with step-by-step analysis instructions, proven methodologies for identifying high-impact optimizations, practical frameworks for diagnosing traffic changes, and expert strategies that convert visibility into measurable business results.
What the Performance Report in Google Search Console Measures
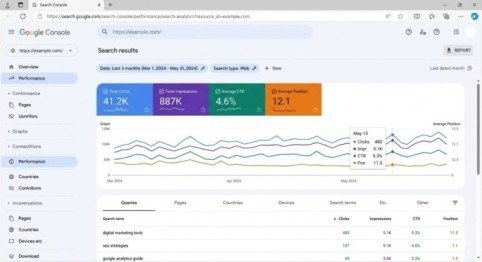
The Performance Report in Google Search Console tracks four fundamental metrics that together tell your complete search visibility story. Understanding what each metric represents and how they interconnect enables strategic optimization decisions rather than reactive guesswork.
Total Clicks
Clicks measure how many times users clicked your website from Google search results. Each click represents someone who saw your page in results and decided it answered their query better than competing pages. This metric directly correlates with organic traffic from Google and serves as the primary success indicator for search visibility efforts.
Total Impressions
Impressions count how often your pages appeared in search results regardless of position or whether users scrolled to see them. Google counts an impression whenever your URL renders in a result set, even if it appears on page three or users never scroll down far enough to see it. Impressions measure potential visibility—the total audience who could have clicked if your result appeared compelling enough or ranked higher.
Click-Through Rate (CTR)
CTR divides clicks by impressions, expressing what percentage of people who saw your result chose to click it. A 5% CTR means five people clicked for every 100 impressions. This metric reveals how effectively your titles and meta descriptions attract attention compared to competing results. High impressions with low CTR signal opportunity—you already rank well enough for visibility but fail to convert that visibility into traffic.
Average Position
Average position shows where your pages typically rank in search results, weighted by impression volume. A position of 3.5 means your average ranking across all queries and impressions falls between positions three and four. This metric provides directional guidance about whether you need to improve rankings or optimize existing positions for better CTR.
Critical 2026 consideration:
AI Overviews appearing above traditional results affect CTR expectations. Queries triggering AI summaries show lower CTR at all positions as some users find answers without clicking any result.
How to Access the Performance Report in Google Search Console
Navigate to Google Search Console and select your property from the dropdown in the top-left corner. Click “Performance” in the left sidebar, then “Search results” to access the complete Performance Report interface.
Before analyzing data, configure three critical settings to ensure accurate interpretation:
Date Range Selection:
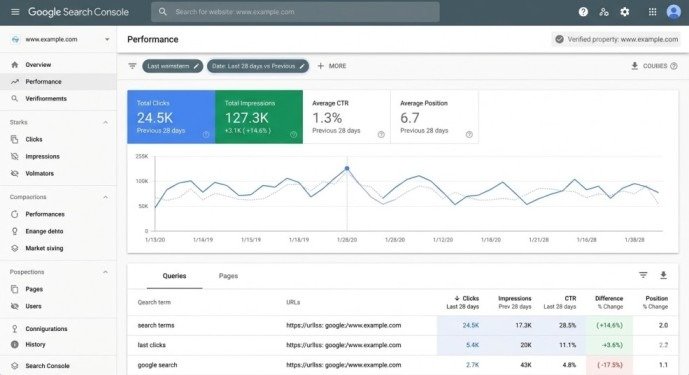
Click the date range selector at the top and choose a meaningful comparison period. For routine analysis, select the last 28 days compared to the previous 28 days. For seasonal content, compare the same period year-over-year to eliminate seasonal bias.
Metric Activation:
Enable all four metric checkboxes (Clicks, Impressions, Average CTR, Average Position) to see complete performance data. Viewing multiple metrics simultaneously reveals correlations—like impression increases paired with position improvements.
Dimension Tabs:
The report displays data across five dimensions—Queries, Pages, Countries, Devices, and Search Appearance. Understanding when to analyze each dimension prevents missing critical insights buried in aggregate data.
Analyzing Performance Report in Google Search Console Metrics
Spotting High-Potential Pages
Pages generating substantial impressions but low CTR represent immediate optimization opportunities. These pages already rank well enough for visibility but fail to convert that visibility into clicks through unappealing titles or meta descriptions that don’t match search intent.
To identify these quick wins, filter the Pages tab to show only pages with at least 100 impressions in your selected date range. Sort by impressions descending, then scan the CTR column for values below 2-3%. These pages get seen but ignored—fixing titles and descriptions often doubles or triples click volume without any ranking improvements.
Identifying Quick-Win Keywords
Queries ranking in positions 8-20 offer exceptional optimization opportunities. These terms already demonstrate Google considers your content relevant, but you sit just outside the high-visibility zone. Moving from position 15 to position 5 can increase clicks tenfold because users rarely scroll past the first page.
Filter the Queries tab to show only queries with average position between 8 and 20. Sort by impressions descending to prioritize high-volume opportunities. For each query, click through to see which page ranks, evaluate whether that page genuinely targets the query, then strengthen content depth, add unique insights competitors lack, or improve internal linking from high-authority pages to boost rankings into the top five.
Understanding Position vs. CTR Relationships
Positions 1-3 typically capture 50-70% of all clicks, with CTR dropping dramatically as position declines. However, AI Overviews disrupt these historical CTR expectations. When Google displays AI summaries answering queries directly in results, even position one pages see lower CTR because some users never click through after reading the AI-generated answer.
Compare CTR performance at similar positions across different query types. Informational queries like “how to verify domain DNS” may show lower CTR when AI Overviews answer questions directly. Commercial queries like “best project management software” maintain higher CTR because AI can’t make purchase decisions for users.
Using Dimensions for Strategic Insights
Query Analysis
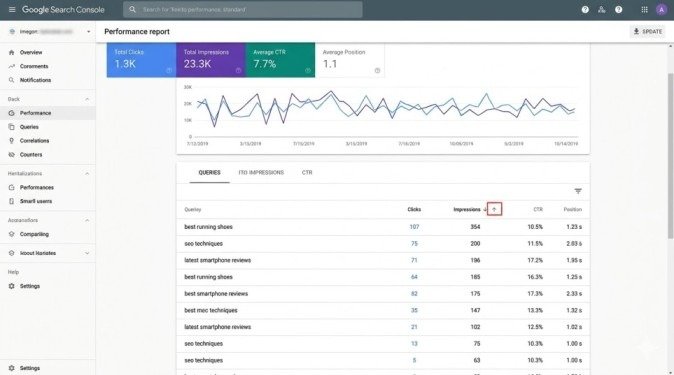
The Queries dimension reveals which search terms trigger your pages. Sort by clicks descending to see your highest-traffic keywords. Then sort by impressions descending to find queries with visibility but poor conversion—high impressions with low clicks indicate compelling title/description problems or position issues.
Filter queries containing question words (how, what, why, when, where) to identify informational content opportunities. These queries often have lower competition and conversion potential for lead generation content strategies.
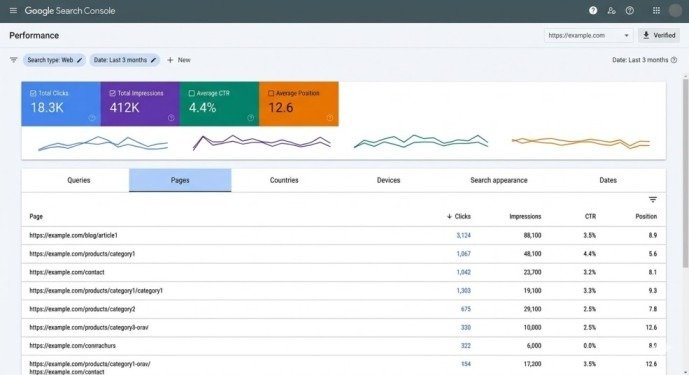
Page Analysis
The Pages dimension shows which URLs generate the most search traffic. Sort by clicks descending to identify your star performers, then analyze what makes them successful—content depth, unique data, better E-E-A-T signals, stronger backlink profiles—to replicate success across other content.
Look for pages with high impressions but low clicks. These URLs rank well but fail to attract clicks, signaling optimization opportunities through improved titles, meta descriptions, or search appearance features like FAQ schema or review markup.
Device and Country Segmentation
Filter by device to compare mobile versus desktop performance. In 2026, mobile-first indexing means Google primarily uses mobile versions for ranking decisions. If desktop performance significantly exceeds mobile, investigate mobile usability problems, slow mobile page speeds, or content hidden on mobile views.
Country segmentation reveals geographic performance variations. If your product serves multiple markets, compare performance across key countries. Strong impressions with weak clicks in specific countries may indicate language localization problems, cultural relevance gaps, or local competitors with stronger brand recognition requiring adjusted strategies.
Diagnosing Traffic Changes
When clicks drop, the Performance Report reveals exactly what changed and where to focus recovery efforts.
Declining Impressions with Stable Position
This pattern signals decreased search demand rather than ranking losses. Seasonal topics naturally fluctuate—tax preparation content peaks in spring, holiday shopping content peaks in winter. If impressions decline but position remains stable, your rankings didn’t change—fewer people searched for your terms.
Declining Position with Stable Impressions
This pattern indicates ranking losses. Demand remains constant (stable impressions) but your pages rank lower (declining position), resulting in fewer clicks. Investigate what changed—did competitors publish better content, did they earn new backlinks, or did algorithm updates favor different content types? Compare your content depth, authority signals, and user experience against new top-ranking competitors.
Declining CTR with Stable Position and Impressions
This unusual pattern suggests SERP feature changes affected your appearance. Perhaps Google started showing AI Overviews for queries where you previously ranked first, shifting your result lower visually even though technical position stayed the same. Review example queries to see what features now appear above your listing.
Advanced Filtering Techniques
Branded vs. Non-Branded Analysis
Filter queries to separate branded terms (containing your company or product names) from non-branded generic terms. Branded traffic indicates existing awareness driving search demand. Non-branded traffic represents genuine content discovery through organic search.
Compare growth rates between segments. Healthy SEO programs show non-branded traffic growing faster than branded, indicating expanding visibility beyond existing customers who already know your brand.
Regular Expressions for Pattern Matching
Use regex filters to analyze query families sharing common characteristics. Filter queries matching “how to.*” to see instructional content performance, “.*near me” for local intent queries, or “.vs.” for comparison content. These patterns reveal which content types drive your traffic and where expansion opportunities exist.
Connecting Performance Data to Business Goals
Mapping Queries to Conversion Potential
Not all clicks create equal value. Export Performance Report data to Google Sheets, then tag queries by business intent—informational queries drive awareness, consideration queries indicate evaluation, and transactional queries signal purchase readiness. Prioritize optimization efforts on high-intent, high-impression queries that align with conversion goals rather than chasing traffic volume on low-value informational terms.
Calculating Traffic Potential
For queries ranking positions 8-20, calculate potential traffic gains from ranking improvements. Multiply current impressions by expected CTR at target position. A query with 10,000 monthly impressions at position 12 (0.5% CTR = 50 clicks) could generate 500 clicks at position 3 (5% CTR)—a 10x improvement justifying significant optimization investment.
Best Practices for Performance Report Analysis
Establish weekly analysis routines checking the last seven days versus the previous seven for early trend detection. Run monthly deep analyses comparing 28-day periods to previous periods, identifying high-impact optimization opportunities.
Export data quarterly for long-term trend tracking beyond Google Search Console’s 16-month retention window. Build spreadsheets correlating Performance Report changes with content updates, backlink acquisition, and technical improvements to measure optimization ROI accurately.
Document every optimization action with the specific Performance Report data justifying it. When you improve a page title, screenshot the before CTR and track improvement afterward. This attribution connects SEO activities to measurable results, demonstrating program value to stakeholders.
Conclusion
Learning how to use Performance Report in Google Search Console for SEO replaces guesswork with data-driven optimization. This essential tool reveals exactly which pages generate visibility but fail to convert it into traffic, which queries offer quick wins through modest ranking improvements, and where systematic problems hide in aggregate statistics.
The systematic approach starts with weekly metric reviews in the Performance Report in Google Search Console identifying CTR anomalies and position changes, monthly deep-dive analyses finding high-potential optimization opportunities, and quarterly trend tracking measuring long-term program effectiveness. Each analysis session takes 15-30 minutes but uncovers insights justifying hours of strategic optimization work.
Start this week. Open your Performance Report in Google Search Console, identify three pages with high impressions but CTR below 2%, improve their titles and meta descriptions to better match search intent, then track CTR changes over the next two weeks. This simple exercise demonstrates how strategic Performance Report in Google Search Console analysis converts existing visibility into measurable traffic gains without any ranking improvements required.
Frequently Asked Questions
Why does Performance Report data differ from Google Analytics?
Performance Report measures search visibility (impressions) and SERP interactions (clicks) while Analytics measures on-site behavior after clicks. Technical measurement differences, user consent blocking Analytics but not Search Console, and redirect handling create natural discrepancies. Use Performance Report for search visibility analysis and Analytics for conversion tracking.
How often does Performance Report data update?
Data updates daily with approximately 2-3 day delay. Performance from three days ago appears completely reliable, while yesterday’s data remains incomplete as Google processes all impressions and clicks globally.
What does “Data processing” mean? Google occasionally shows “Data processing” messages when aggregating large datasets or during reporting infrastructure updates. Wait a few hours and refresh—data typically appears within 24 hours.
Meta Description
Learn how to use Performance Report in Google Search Console for SEO! Complete 2026 guide with metrics analysis, quick wins identification, and traffic optimization strategies.
- What the Performance Report in Google Search Console Measures
- How to Access the Performance Report in Google Search Console
- Analyzing Performance Report in Google Search Console Metrics
- Using Dimensions for Strategic Insights
- Device and Country Segmentation
- Diagnosing Traffic Changes
- Advanced Filtering Techniques
- Connecting Performance Data to Business Goals
- Best Practices for Performance Report Analysis
- Conclusion
- Frequently Asked Questions
- Meta Description